SEC staff recently released observations regarding registrants’ use of custom axis elements (or custom dimensions) in XBRL reports. The results of their analysis showed that while the overall use of custom axis elements has been declining since 2013, over half of all filers continue to use one or more custom axis elements in their annual reports.
Because of the number of standard axis tags available in the US GAAP taxonomy and because the average annual report only uses about 20 axis elements in total, the SEC feels that the need to create and use custom axis elements should be infrequent. If you find that your company has been using a custom axis element in their XBRL exhibit, you should review the following observations that the SEC staff found during their analysis and then continue reading to learn some helpful tips for how to avoid using custom axis elements by improving your ability to locate standard axis elements within the taxonomy.
The SEC lists the following as their notable examples of inappropriate custom axis usage:
- Creation of custom axis tag when appropriate standard axis tag already existed in the U.S. GAAP Taxonomy. Staff observed instances where filers created a custom axis tag when an appropriate standard axis tag existed. For example, there is already a standard axis for subcategories of “cash and cash equivalents.” It is inappropriate to create a custom axis tag for “only cash.”
- Creation of custom axis tag for reuse when appropriate standard axis tag already existed in the U.S. GAAP Taxonomy. Some standard axis tags are provided with the intent to be reused no matter where and how many times in the exhibit they appear. For example, standard axis tags that provide for subcategories of minimum, maximum, weighted average, and average values already exist. It is inappropriate to create custom axis tags for those same purposes.
- Creation of non-practical custom axis tags. Sometimes specific disclosures do not require an axis tag at all. For example, there are a number of different standard line items for each type of debt. It is inappropriate for a filer to create a custom “type of debt” axis to subcategorize generic “debt” line items when the standard line items should be used to capture that information.
These issues can all be resolved by understanding the purpose of axis elements and how to properly search the US GAAP taxonomy for them.
Tips for Finding the Appropriate Axis Element
1. Look on the standard taxonomy tree for the recommended axes for the type of presentation.
Most presentations have axis elements that are commonly used for them. By viewing the US GAAP taxonomy in a viewer that allows you to see the taxonomy in a tree, you will be able to see relationships between various elements. Each presentation will have a root element, including the presentations for tables contained in the notes to financials. Once you have located that root element, you can expand the tree to view the recommended children for that element.

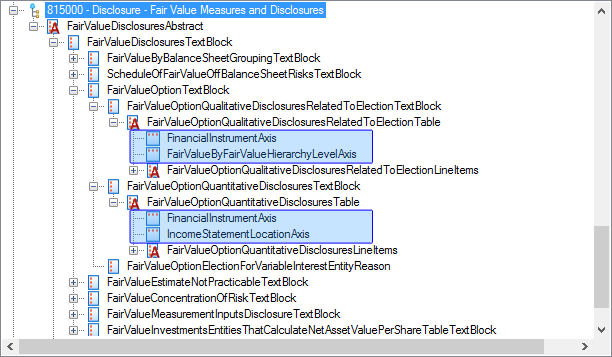
In the example above, we have expanded some of the table elements that might be used in the Fair Value Measures and Disclosures note in order to view their children in the standard 2016 US GAAP taxonomy. The recommended axis elements for two of the tables that often appear in this note are highlighted in blue.
It’s important to note, of course, that an axis element may be used on a table that doesn’t show that element as a child in the standard taxonomy. The standard taxonomy shows only the most commonly used axis elements for each table. This is simply the best place to start when looking for an axis element. If there isn’t an axis element that accurately describes the concept you need that is a child of your table element, don’t make a custom axis element just yet. There are a few more things to check first.
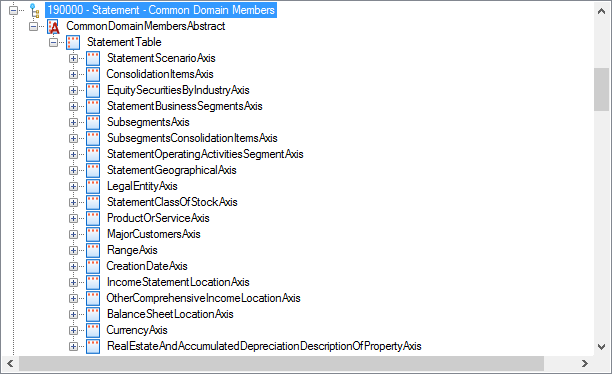
2. Use the 190000 - Statement - Common Domain Members presentation to look for the most common axis elements used in face financials.
For your face financials, the US GAAP taxonomy even provides a list of domain member elements that are commonly used right within the standard taxonomy. Again, using a viewer that allows you to search elements in a tree will allow you to see all of the common domain and their associated axis elements by locating the Common Domain Members branch of the tree.

If you can find a domain member element within this presentation that matches the concept for one of your line items or columns, then you can work backwards to find its associated axis element.
3. Search for the concept, not the label text!
It’s fairly common for filers to use the label of a line item or column as a starting point when searching the taxonomy. Distilling a label into keywords often helps locate the desired element. However, when it comes to axis elements, this is not always going to be the case.
In the official document, the label associated with a column or line item will more frequently be a label for the member element within the axis’ associated domain. Searching for keywords based on the label might help you find the axis element in a roundabout way by aiding you in locating the appropriate domain member element, but it will rarely locate the axis element directly.
In the case of the axis element, it is far better to create keywords based on the concept that the axis is being used to describe. For example, you may have a table that shows different currencies hedged. Instead of using the labels, which may say something like “Euro/U.K. Pound Sterling”, as a basis for your search, use the concept of “currency” instead. In another example, you may need a dimension for various countries in which your company operates. Instead of searching for a specific country, search for geographic locations.
4. Look for two simpler axes instead of one complicated axis.
Using one custom axis element to represent two dimensions on a table is a common mistake. Filers may find it easier to create one axis element for a presentation than to have to appropriately use two axis elements for their table. But while this may seem to be a time-saver, it’s wrong and it makes it impossible for consumers of XBRL data to properly compare your financial information with your peers’.
Before you start your search for an axis element, think about the concept you are trying to represent and ask yourself if you are attempting to represent one concept or more. For example, if you have a table where you need a dimension to represent “North American Asset-Backed Securities”, spend a few minutes to think about that dimension. If you can distill it into smaller pieces, do that before you search. In this case, you have “North America” and
“Asset-Backed Securities”. Combining this tip with Tip 3, you should be thinking of search terms that are concepts: a geographic location and a type of investment.
Instead of creating a custom axis element that is InvestmentsByLocation, you should use two standard axis elements: StatementGeographicalAxis and InvestmentTypeAxis.
5. If your software supports filtering like GoFiler, use it to filter for only xbrldt:dimensionItem elements.
While this tip is highly dependent on the software you use to view taxonomies and to create XBRL reports, if you have access to this feature, it can easily help you eliminate custom axis elements. Compared to the thousands of elements contained in the US GAAP taxonoy, there are only 200-300 that are axis elements. Once you have this filter in place in your search, you can use keywords related to the concept you are trying to represent to narrow the field even further. What before seemed like a daunting search is now manageable!
Sources:
Staff Observations of Custom Axis Tags (www.sec.gov)


